
hospitality
Same brand flag. Different rebooking rates. We'll tell you why.
Resultid connects guest voice, staff reports, and operational data to surface what drives performance across every property, brand, and service.
Same brand flag, same market, 18 points apart on rebooking. The difference lives in shifts and handoffs, not in the survey.

1,200+
Properties Profiled
+23%
Avg Rebooking Lift
30 days
To First Insight
Weekly
Property-level Briefs
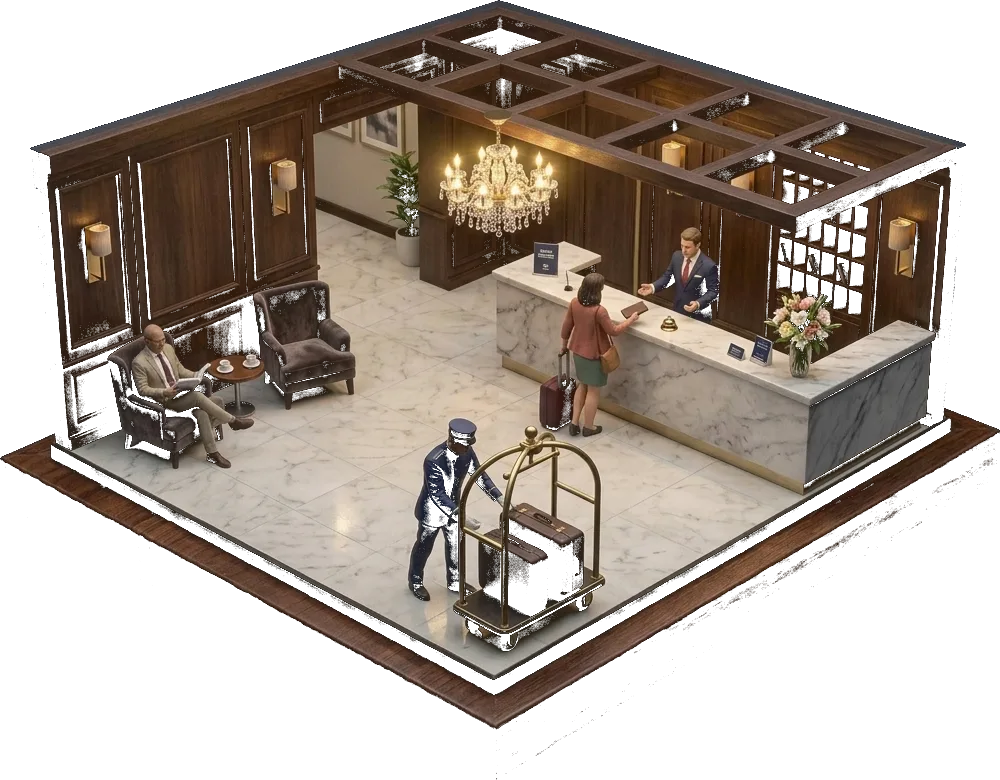
Property by property
Explain why your best property beats your worst.
Guest surveys tell you a room was cold, not why, not whose shift, not which floor. Resultid connects stays, staff reports, and reviews so GMs know where to act.
A property GM at a top-20 hotel group sees two satisfaction dashboards, an OTA review digest, and a Friday email from corporate. None of it tells her why her property is 18 points behind the one on the next block flying the same flag. The signals that would explain it (turn-down timing, a specific front-desk handoff, a housekeeper rotated to the wrong floor) live in different systems or nobody's laptop. Most groups never connect them.
What GMs get
Platform
Surface what drives rebookings, reviews, and revenue at every property.
Three things the platform does for a hotel group, each delivered to GMs and department heads weekly.
Property Performance Intelligence
Two resorts on the same brand flag end the quarter 18 points apart on rebooking: same price, same market. The gap is in front-desk handoffs, turn-down timing, and which housekeeping shift inherits the 4:00 PM check-in. We surface the specific operational signals that move the number.
Guest and Staff Voice Synthesis
Post-stay surveys, OTA reviews, concierge notes, mystery-guest evaluations, and F&B complaints, unified into one operational view. GMs see why rebooking dropped this week, not a trailing-90-day satisfaction score.
Service Gap Alerts
Housekeeping delays, maintenance backlog, and F&B complaints surface as review trends 30 days early. Service recovery beats damage control.
In practice
How hotel groups explain property-level performance on the same brand flag.
GMs get weekly intelligence tied to specific shifts, floors, and departments, not a brand-level satisfaction index that moves too slowly to act on.
As a leader in guest experience, you understand that property performance depends on understanding what guests and staff actually experience, not just what satisfaction scores suggest. Your team manages feedback from surveys, reviews, staff reports, and guest interactions across dozens of properties.
Yet connecting these signals into a single intelligence layer that explains performance differences at the property level remains an unsolved challenge. Without it, decisions are made on brand averages that hide the specific actions that would move the needle at individual properties.
Find out why your Paris property outperforms your Amsterdam one.
Surface the insights hiding in guest feedback across every property and brand.